Eliminating AWS Lambda Cold Starts: A Deep Dive into Latency Optimization
Summary
Cold starts in AWS Lambda can add hundreds of milliseconds to request latency. This post explores the root causes, quantifies the impact, and walks through proven strategies to eliminate them in production.
What a cold start actually is
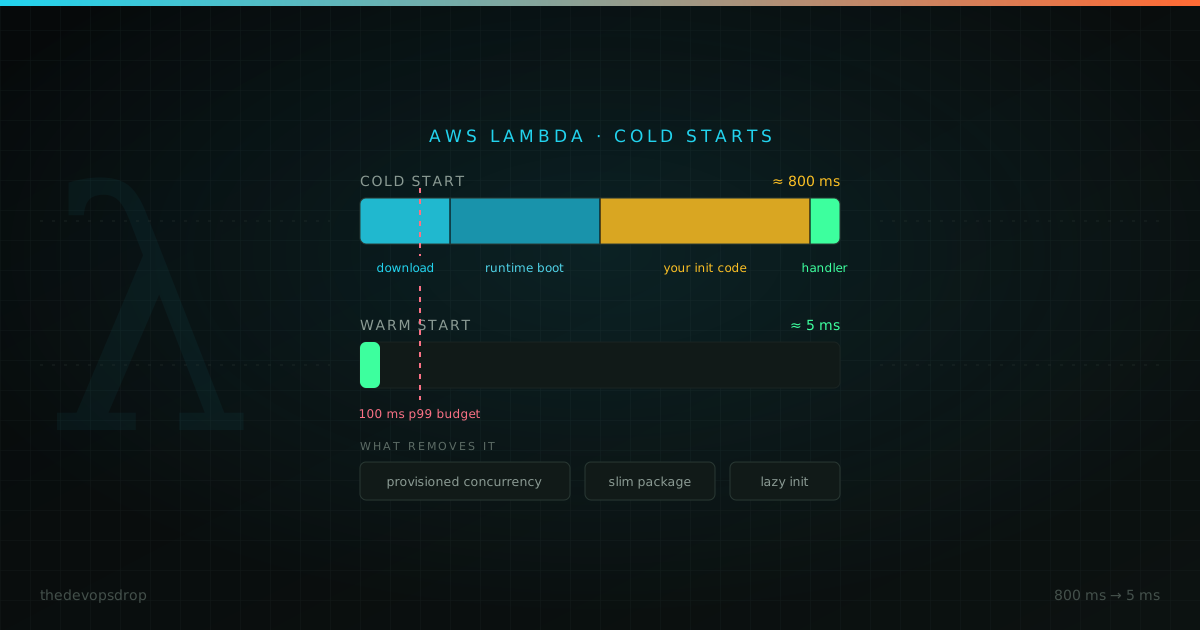
When there's no warm execution environment available, Lambda has to build one: download your deployment package from S3, boot the runtime, run your initialisation code, and only then handle the request. That's typically 100-1000ms depending on runtime, package size, and how much work you do at module scope.
For a background job nobody notices. For a user-facing API it's the difference between a 5ms response and an 800ms one, against an SLA that probably says p99 under 100ms. It's not a one-off either: every deploy, every scale-down, every traffic spike creates new environments.
Measuring it
Everything you need is already in CloudWatch. Look at the REPORT line:
REPORT RequestId: abc123 Duration: 145.32 ms Billed Duration: 146 ms Memory Used: 128 MB Init Duration: 89.23 msInit Duration only appears on cold starts. Count the invocations that have it, divide by total invocations, and you have your cold start rate. Multiply init duration by cold start count by your per-ms price and you have the direct cost, which is usually small. The latency damage is the expensive part.
Fixing it
Provisioned Concurrency
The one that actually works. AWS keeps N environments initialised and ready, so your baseline traffic never sees a cold start. It's billed per GB-second at roughly $0.0000041667, so the monthly cost scales with the memory you allocate: a 512MB unit held 24/7 runs about $5.40/month, a 1GB unit about $11. Small compared to the latency it buys back.
Set it to your sustained peak, not your absolute peak. Bursts above that will still cold-start, which is fine.
Shrink the package
Smaller packages download and initialise faster. Bundle with esbuild or swc so you ship one file instead of a node_modules tree, tree-shake what you don't use, and move heavy imports out of module scope. Going from 50MB to 10MB is worth roughly 40-50ms.
Do less at init
Anything at module scope runs on every cold start:
// runs on every cold start, whether you need it or not
const dynamodb = new AWS.DynamoDB();
const s3 = new AWS.S3();

exports.handler = async (event) => { /* ... */ };
// created on first use, then reused for the life of the environment
let dynamodb;
let s3;
exports.handler = async (event) => {
dynamodb ??= new AWS.DynamoDB();
s3 ??= new AWS.S3();
/* ... */
};The second version still caches across warm invocations. You just stop paying for clients a given request never touches.
SnapStart, if you're on Java
Lambda snapshots the initialised JVM and restores from it, which takes a Java cold start from around 1000ms down to somewhere near 50ms in most cases. No code changes needed beyond making sure anything non-deterministic (random seeds, unique IDs, open connections) is regenerated after restore rather than baked into the snapshot. If you run Java on Lambda and haven't turned this on, do that first.
Give it more memory
Memory and CPU are the same dial on Lambda. More memory means faster init and faster execution, so the billed duration often drops enough to partly pay for itself:
- 128MB: ~350ms cold start, ~1000ms billed
- 512MB: ~200ms cold start, ~300ms billed
Don't guess. The sweet spot is workload-specific and it's easy to find by measuring a few settings directly.
Reuse connections
For anything making outbound HTTP calls, create the agent once and let it live across invocations:
const https = require('https');
const client = new https.Agent({ keepAlive: true });

exports.handler = async (event) => {
  // reuses the pooled connection on warm invocations
};
Watching it in production
Alarm on init duration and track the cold start rate over time. With Provisioned Concurrency sized correctly it should stay under 5%; if it starts climbing, either your traffic pattern changed or your provisioned count is stale.
MetricName: Duration
Filter: "Init Duration"
Alarm: Average > 100ms for 2 datapoints
What this looks like in practice
Illustrative numbers for a mid-size payment API, to show the shape of the trade-off rather than a guarantee of what you'll see:
| Change | Cold start | Warm | Monthly cost |
|---|---|---|---|
| Baseline | 450ms | 15ms | $10,000 |
| Bundled package | 280ms | 12ms | $10,000 |
| + Provisioned Concurrency (5 units) | 0ms | 12ms | $10,074 |
| + 512MB memory | 0ms | 8ms | $10,150 |
Around $150/month on a $10k bill, for a roughly 87% drop in p99.
The recommended setup
Provisioned Concurrency at sustained peak load, reserved concurrency at about 2x that to absorb spikes, and alarms on cold start rate and init duration. That keeps cold starts rare enough to stop mattering while the cost stays a rounding error.